Alright, I have put together a tiny script with tablesorting (if you click on the table head). You need to copy the qa-config.php in the same folder:
<?php
// CONNECT TO DATABASE
require_once( 'qa-config.php' );
mysql_connect(QA_MYSQL_HOSTNAME, QA_MYSQL_USERNAME, QA_MYSQL_PASSWORD) or die(mysql_error());
mysql_select_db(QA_MYSQL_DATABASE) or die(mysql_error());
// userid
$queryQuestions = mysql_query('SELECT created
FROM `qa_posts`
WHERE `type`="Q"
ORDER BY created DESC
'); // LIMIT 0,10;
$questions = array();
$c = 0;
while($row = mysql_fetch_assoc($queryQuestions)) {
// take substring, only date from 2013-01-04 15:18:03
$questions[++$c] .= substr($row['created'],0,10);
}
// initial html
echo '<html>
<head>
<style type="text/css">body{margin:30px 30px 50px 30px;padding:0;font-family:Arial,Tahoma,Verdana,sans-serif;font-size:14px;background:#FFF;color:#121212} h2{color:#006;font-weight:normal;font-size:24px;font-size:160%;padding:0;margin:0} td{border:1px solid #CCC;padding:0 .5em;line-height:25px} tr:hover{background:#ffc} table{background-color:#EEE;margin:30px 0 15px;width:500px;text-align:left;border-collapse:collapse} table thead tr th, table tfoot tr th{background-color:#cfc;border:1px solid #CCC;padding:4px;cursor:pointer;}</style>
<script src="http://ajax.googleapis.com/ajax/libs/jquery/1.8.3/jquery.min.js"></script>
<script src="https://raw.github.com/Mottie/tablesorter/master/js/jquery.tablesorter.min.js"></script>
<script type="text/javascript">
$(document).ready(function() {
$(".tablesorter").tablesorter();
});
</script>
</head>
<body>
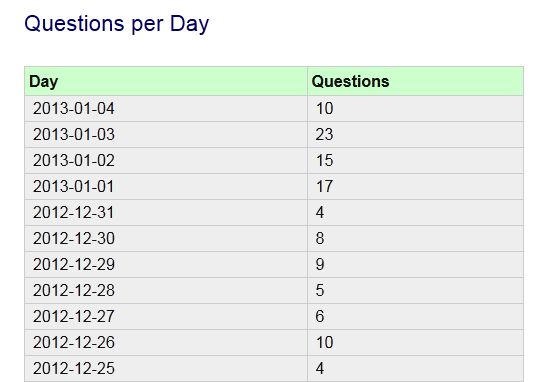
<h2>Questions per Day</h2>
<table class="tablesorter"><thead><tr><th>Day</th> <th>Questions</th> </tr></thead>';
$questionsDays = array_count_values($questions);
$sum = 0;
$countDays = 0;
foreach ($questionsDays as $day => $nrQuestions) {
echo '<tr><td>'.$day.'</td> <td>'.$nrQuestions.'</td></tr>';
$sum += $nrQuestions;
$countDays++;
}
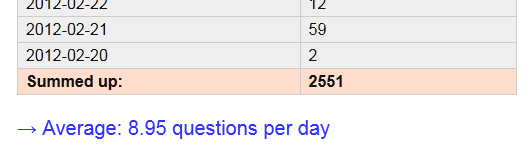
echo '<tr style="background:#FDC;"><td><b>Summed up:</b></td> <td><b>'.$sum.'</b></td></tr>';
echo '</table>';
echo '<p style="color:#33F;font-size:20px;">→ Average: ' . round($sum/$countDays,2) . ' questions per day</p>';
echo '</html></body>';
?>
Enjoy this little "starter" =)
Result:
+ showing average in the end: